
CBC Collaboration: Lift Bridge and BrewMonitor
At the 2022 Craft Brewers Conference (CBC), Precision Fermentation teamed up with Lift Bridge Brewing Company to do a tap takeover at Dan Kelly’s Pub in Minneapolis, Minnesota. Guests were invited to come by to try a selection of their recent and flagship brews.
Lift Bridge has brewed beer in Stillwater, Minnesota since 2008. After adding an additional production facility and taproom in New Richmond, Wisconsin, the brewery now has two facilities producing a range of beers, seltzers, and non-alcoholic sodas.
As an early pilot partner, Lift Bridge began a partnership with Precision Fermentation which developed into becoming a dedicated utilizer of the BrewMonitor System. Initially, the team used BrewMonitor to follow repeated fermentations of their base seltzer before turning it toward the full mix of beers they brew, allowing them to track critical metrics for yeast vitality, monitor process benchmarks for improved efficiency, and gain greater insight into fermentation health across a range of styles and fermentation processes.
As CBC approached, it was critical for the brewery to ensure quality. BrewMonitor was deployed on every batch in the final stretch of production, and the team has given Precision Fermentation the unique permission to share some of that data.
Outlined below are a few of the beers Lift Bridge produced in preparation for the spring uptick in sales and 2022 CBC.
Mango Blonde Ale
Real-time yeast vitality monitoring
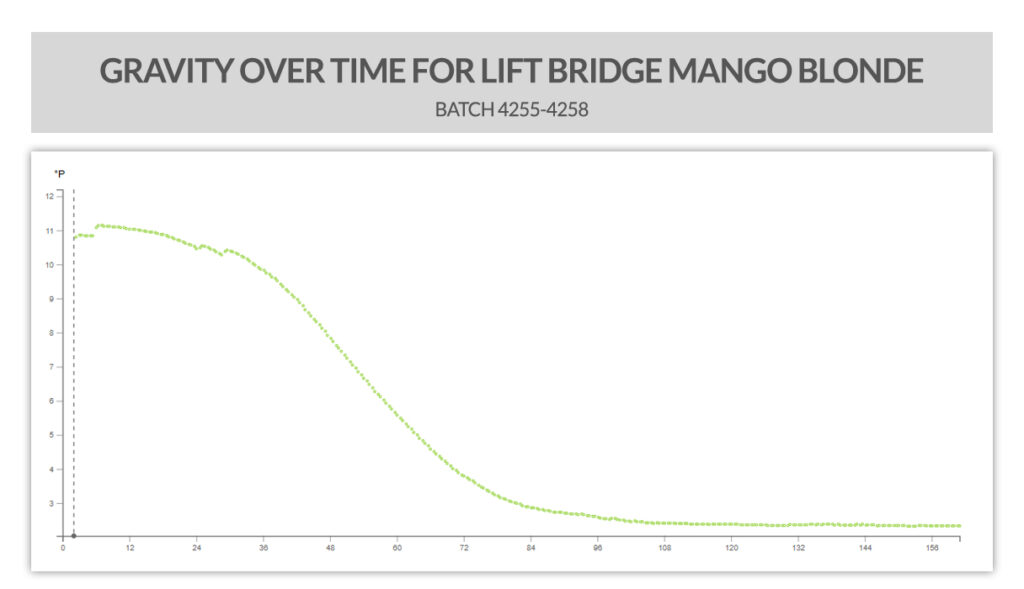
Lift Bridge’s Mango Blonde Ale is a 4.75% ABV seasonal ale. A healthy fermentation for this brand takes inside of 5 days to fully attenuate to a target final gravity of 2 degrees Plato. With the real-time monitoring capability and visualization (seen above) provided by BrewMonitor, interpreting the progress of fermentation is easy. With hour zero being the reported time of the initial yeast pitch, note the 4-batch process is reflected in small increases in gravity around hours six, twenty-five, and twenty-eight. By the third and fourth knockout, the yeast has already begun to pull gravity downward. On the tail end of fermentation, attenuation slows to the smallest crawl around hour 108 and finally ends right around hour 120.
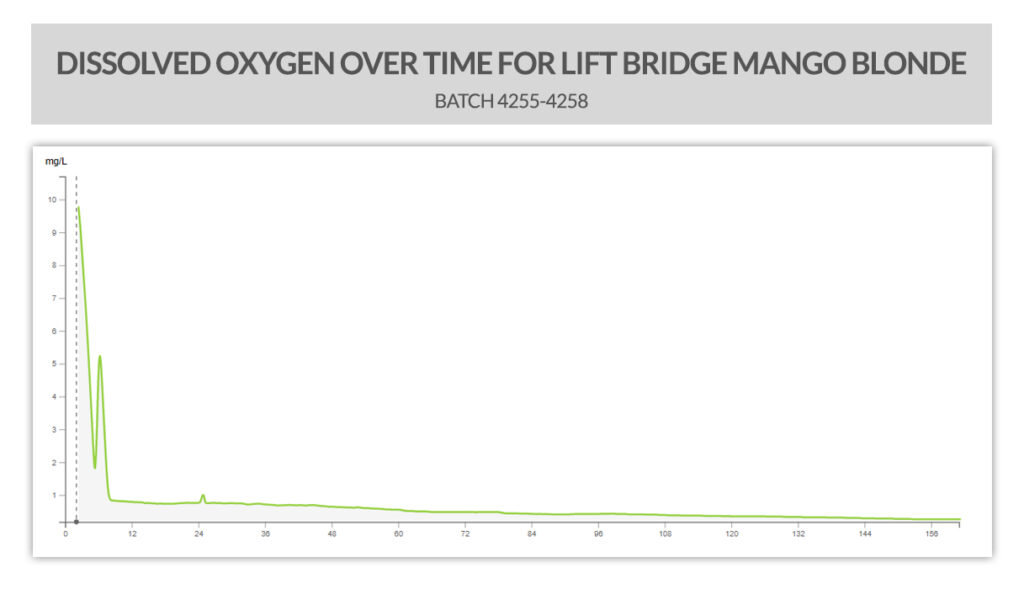
BrewMonitor is also able to provide Lift Bridge with progressive insight into their aeration process on the first two runs of wort into the tank while giving early, lag-phase insight into the relative health of the yeast. This graph is typical of a healthy pitch of yeast: within the first 6-10 hours (longer for lagers), oxygen is fully depleted by the yeast and the low-end threshold of the DO sensor is reached at around 1ppm. Note the second knockout is clearly visible around hour six when DO spikes back upward to just above 5ppm before continuing to deplete. The low-end resolution for the sensor employed here means that DO is effectively “0” after about hour 8.
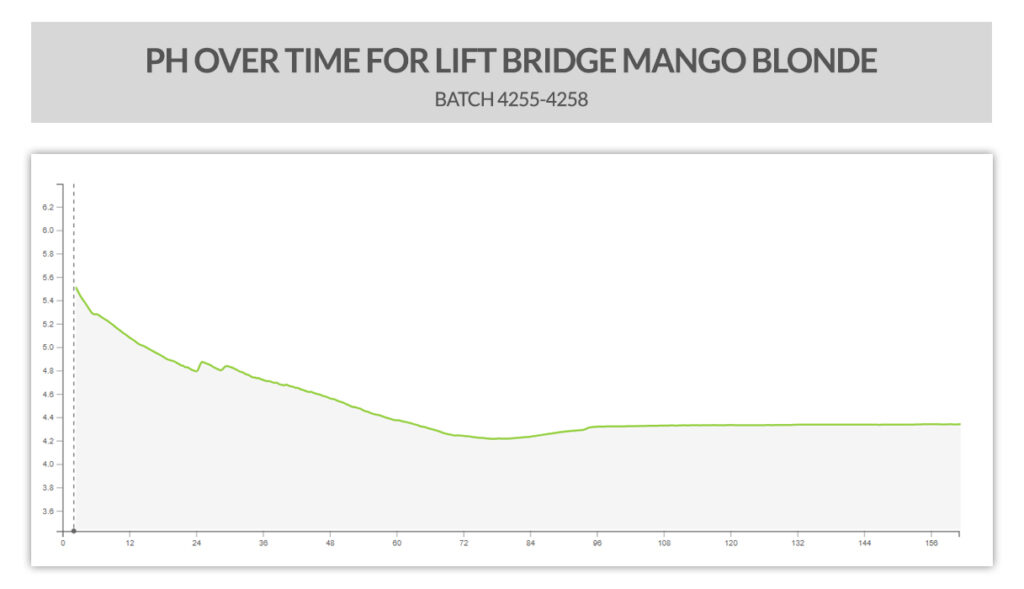
Another excellent lag-phase indicator of yeast health is the progression of pH in the initial hours after pitch. Here, the pH begins to drop as soon as yeast is in contact with the wort and producing acids. The relative rate of acid production depends on the relative health of the yeast pitch, the pitch rate, and the overall viability of the slurry. Later, pH begins to tick back upward right around the time that the rate of gravity change decelerates (here at hour 78). All combined, these gravity, DO, and pH graphs are excellent examples of a healthy fermentation.
Getaway Pilsner
Process control and monitoring
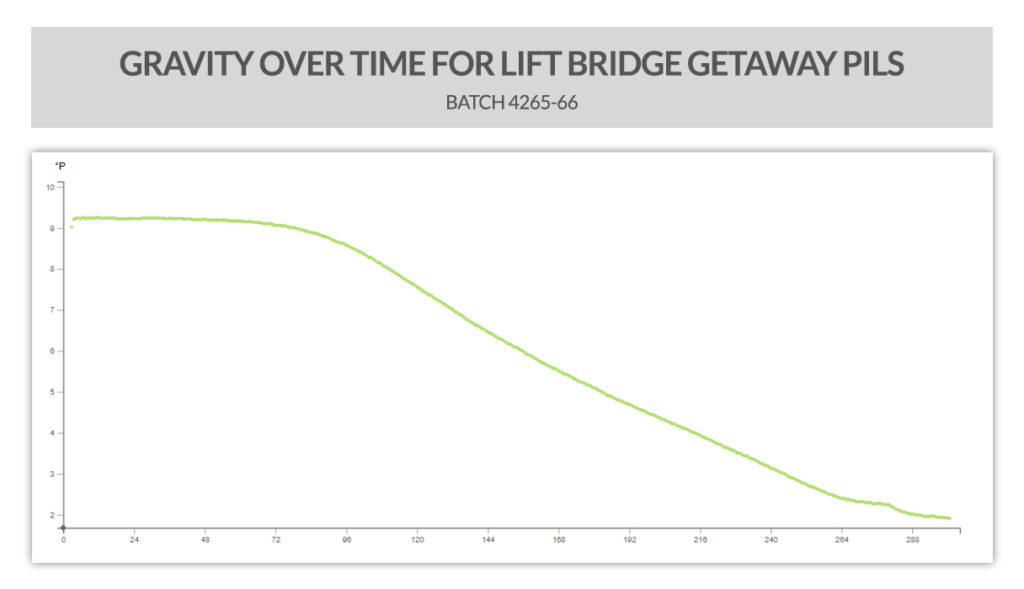
Getaway Pils is a 4% ABV light lager produced year round by the team at Lift Bridge. The gravity graph is straightforward enough, and understandably stretches for a much longer duration than the ale shown previously. With high frequency data from BrewMonitor, It’s easy to see the extended lag phase, slower rate of attenuation from start to end, and hints of the process happening at the tail end of fermentation (note the slowing and reacceleration of the rate of change after hour 264).
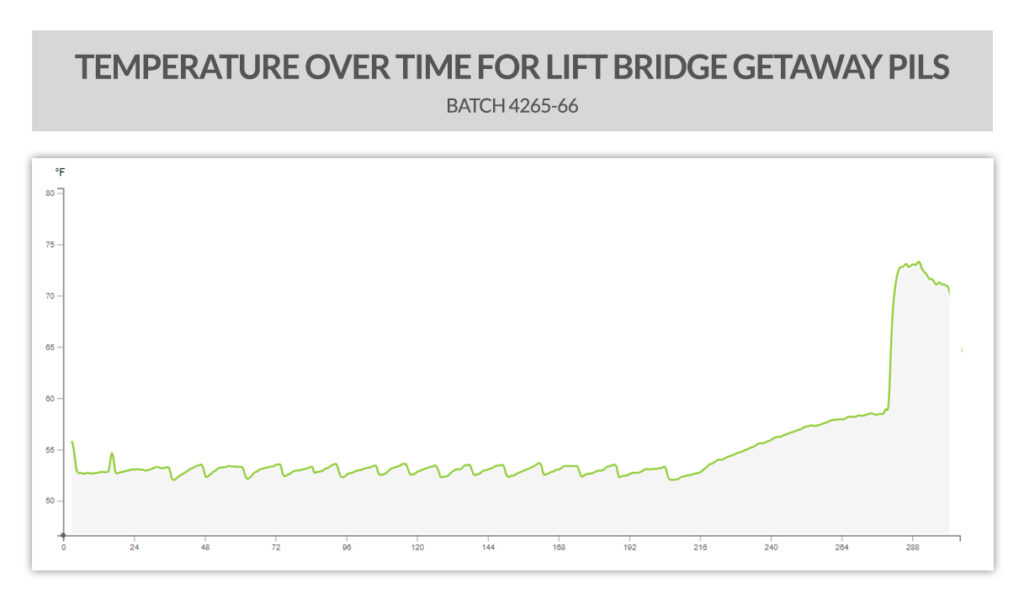
Looking at the temperature log in BrewMonitor reveals big changes at the tail end of fermentation. In the days prior to the fermentation ending, note the relatively slow rise in temperature from around hour mark 216 to roughly hour 275, a classic diacetyl rest. By allowing this process to play out as the change in gravity slows, the brewers are able to efficiently reduce unwanted off-flavors in a timely manner and keep production rolling quickly on a core brand. The team is able to use the real time tracking of gravity to more precisely target a benchmark for when to begin this rest. After the slow rise, the temperature spikes much more quickly, suggesting another process in play.
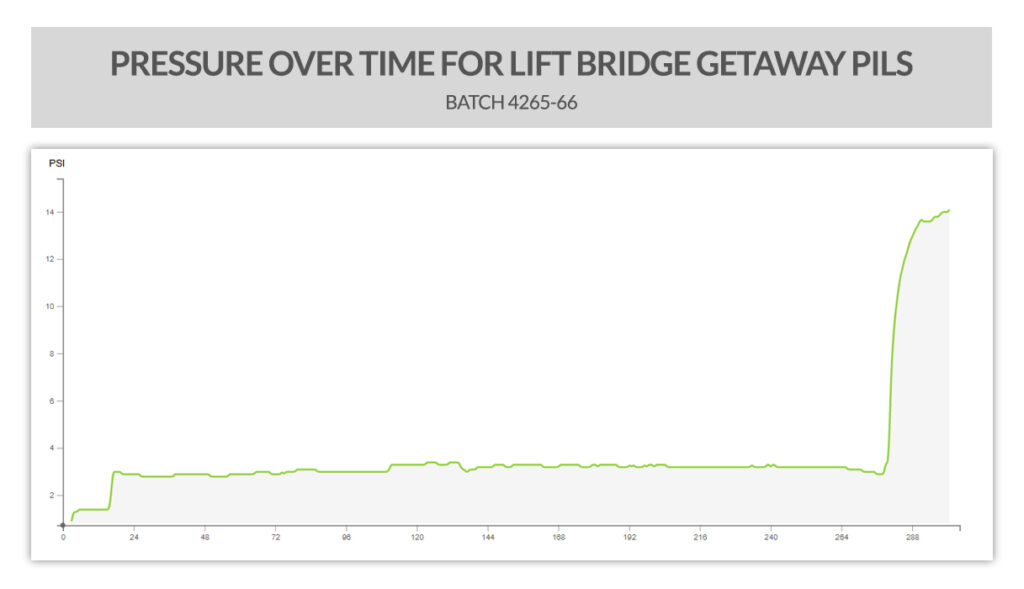
The pressure graph reveals the rest of the picture: the tank was bunged somewhere around hour 275, causing the fluid temperature to also spike. With BrewMonitor continuously delivering data across all of these metrics at once, targeting process benchmarks and forensic troubleshooting of potential issues during fermentation becomes instant and easy.
Juice-Z IPA
Process management with biotransformation and refermentation
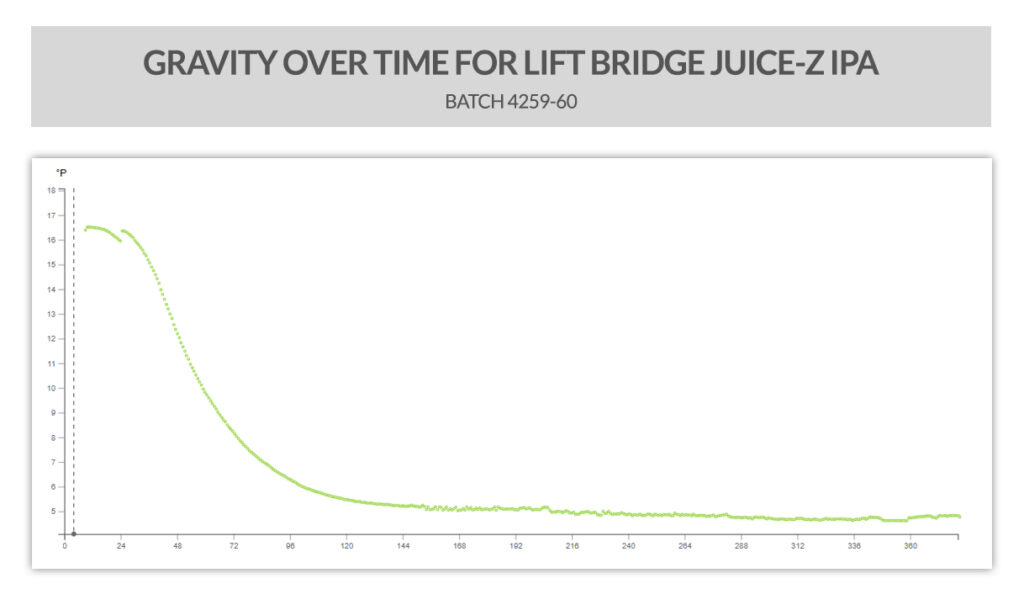
Juice-Z is a New England-style IPA clocking in at 7% ABV and described as having a “monstrous blend of fruit-forward hops.” From the gravity progression shown here, it’s easy to recognize another healthy fermentation, note the second batch of wort added just after the 24 hour mark, and track a potentially problematic issue: biotransformation and refermentation. It’s subtle, but significant to the finished product, and visible in the slow drag downward starting after about hour 200.
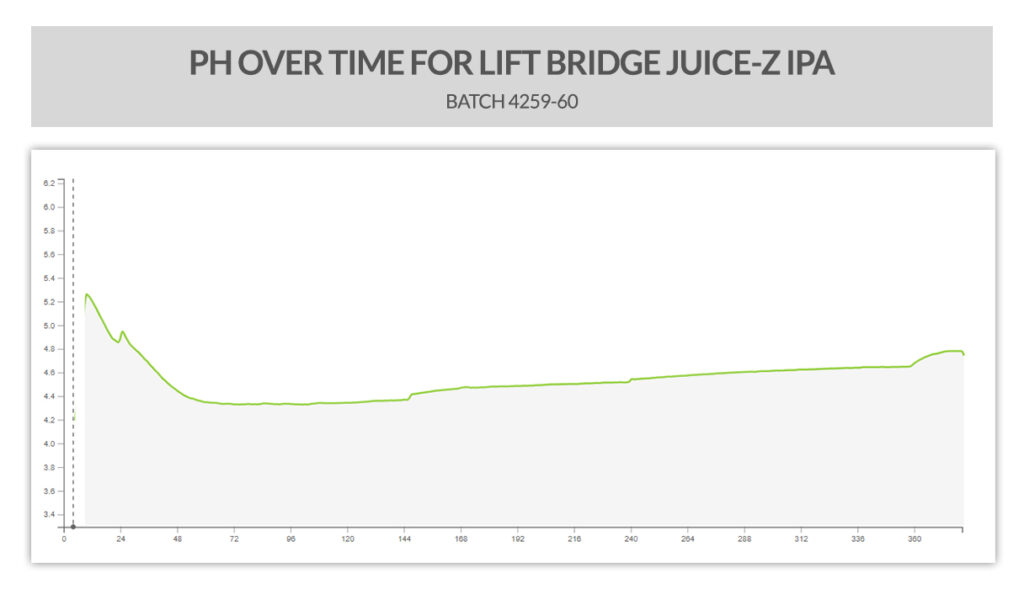
Looking closely at the pH progression over the course of the fermentation reveals evidence of the culprit: dry hop additions. Note the small, quick increases in pH at hour 144 and again at hour 240. The addition of hops causes a small, measurable change and is a telltale sign of the process that can be easily seen with BrewMonitor.
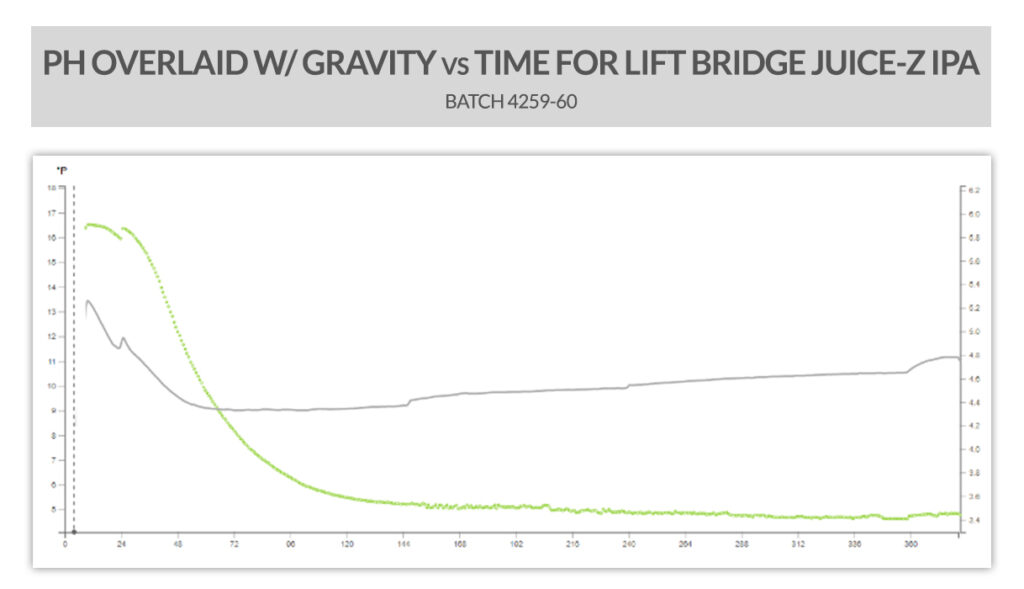
By following these two metrics in tandem, high frequency data from BrewMonitor shows the full picture. After the initial hop addition on day 6, refermentation started around day 8 and stretched to around day 14, reducing the gravity of the beer by another 0.5 degrees Plato. Watching this process closely allows brewers to more precisely monitor hop ‘creep,’ a critical component in ensuring product quality and shelf stability.
Get a unique look inside fermentation tanks.
See how monitoring fills in the picture with never before seen data straight to your computer, tablet or phone, 24-7-365.