
New Research Finds Sampling Inaccurate and Imprecise
MBAA Technical Quarterly just released a research report by University of Northern Colorado. The results may come as a shock to the brewing industry, as it reveals there are biases in density measurements, leading to differences in the accuracy and precision of them.
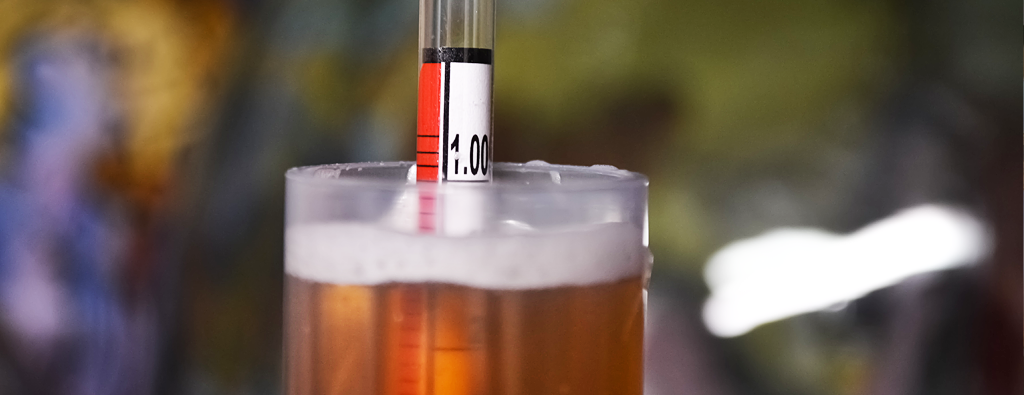
In the study, four methods for the determination of the density of a wort sample were evaluated: a hydrometer, a pycnometer, an Abbe refractometer (Bausch and Lomb Abbe 3L), and an Anton-Parr densitometer (model DMA 35 Basic). Despite following best practices, each method—as is the case with most measurements—revealed biases and errors that occur during the actual measurement. Those biases and errors can be classified into systematic error, operator error (also known as gross error), and random error.
The research team explained, “Any variation in the developed procedure resulted in a dramatic increase in the percent relative standard deviation. This was especially true if the solutions were not attemperated at 20.0°C for at least 20 min. Even a 0.1°C deviation increased the %RSD for the measurement.” But in addition to these variations, errors resulting from parallax also played a large role when using a hydrometer and refractometer.
So what does this mean for your fermentations? Due to the variation in samples, the quality of the data you are gathering may not be giving an accurate depiction of progress. A process to control how samples are taken will need to be implemented in order to try to reduce the error in the data. This means taking measurements in precise intervals using the same exact method for retrieval each time. It also means eliminating the previously mentioned human error of parallax.
You can also mitigate the impact of these highly variable samples by capturing more data to reduce the reliance on any one data point. An increase in the quantity of measurements effectively reduces the overall standard deviation of the set of data, meaning errant individual readings become more starkly apparent while simultaneously less critical to the data set as a whole. In other words, accuracy can be drawn from the abundance of data, rather than the critical precision of any single measurement.
“During the analysis, it was noted that even a 0.1°C deviation of the sample temperature increased the percent relative standard deviation.”
But what if there was a solution that could both increase the quality and quantity of your measurements—something that could reduce the unintentional biases and errors of sampling, while simultaneously shrinking the standard deviation of the resulting data? The BrewMonitor SensorHub pulls fluid every 10 minutes and automatically records seven metrics in the cloud: dissolved O2, pH, gravity, pressure, ambient temperature, fluid temperature, and conductivity. The result is datasets over 70 times larger than what brewers traditionally manage on their own, with high repeatability between each data point stemming from the mechanical method that allows each sample to be taken in exactly the same way.
The BrewMonitor system’s automated, controlled process capabilities provide unparalleled certainty and reliability in product quality measurements. Our patented technology solves process error, operator error (human error), and random error in ways that are not possible with manual tools and processes that are considered best practices.
Schedule a demo today to discover how our technology can increase product quality and consistency by providing over 1,000 controlled data points per day.