BrewMonitor® offers your brewing team access to insight that has never been available before: high-resolution data from inside your fermentation tank, allowing you to track the progress of your fermentation, analyze results, benchmark future batches, and much more. The resulting graphs for each completed fermentation – dissolved oxygen, pH, gravity, pressure, temperature and conductivity – provide extremely clear views into the events that transpired and techniques that were employed.
This series of articles shows examples of data curves from specific parameters, as they were recorded from the fermentation of various styles in different scenarios. These graphs are from actual fermentations, and offered as a look into how these conditions express themselves as measured data trends. In this installment, we step through some examples of typical pH curves. See our earlier post on typical gravity curves »
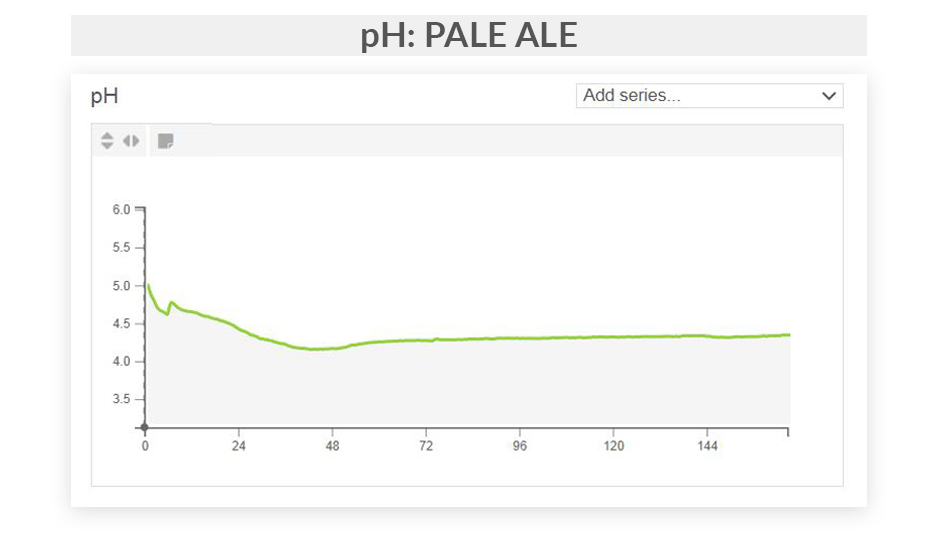
Figure 1: Pale Ale Example. The pH of this pale ale starts just above 5, likely due to manual adjustments of the mash prior to fermentation. The yeast begin to produce organic acids as soon as they are pitched into the beer, and drop the pH even lower. This drop is interrupted by a second knockout, which brings the overall pH of the fermenter up briefly. During peak fermentation, the pH reaches its lowest point as the yeast generate large quantities of pyruvic and succinic acid as part of normal glucose metabolism. As the sugars are consumed, some of these acids are taken up as remaining carbon sources, and the pH level slowly moves up to its end point.
Figure 2: The pH of the lager starts just below 5.5 and moves considerably slower than other beer types owing to the colder fermentation temperature. This slower fermentation means that there is never a significant excess of pyruvic acid in the media because it is being converted to alcohol about as quickly as it is produced. The lager reaches its lowest pH after the period of maximum fermentation, and then rises slightly during conditioning as the last of the acids are taken up by the yeast.
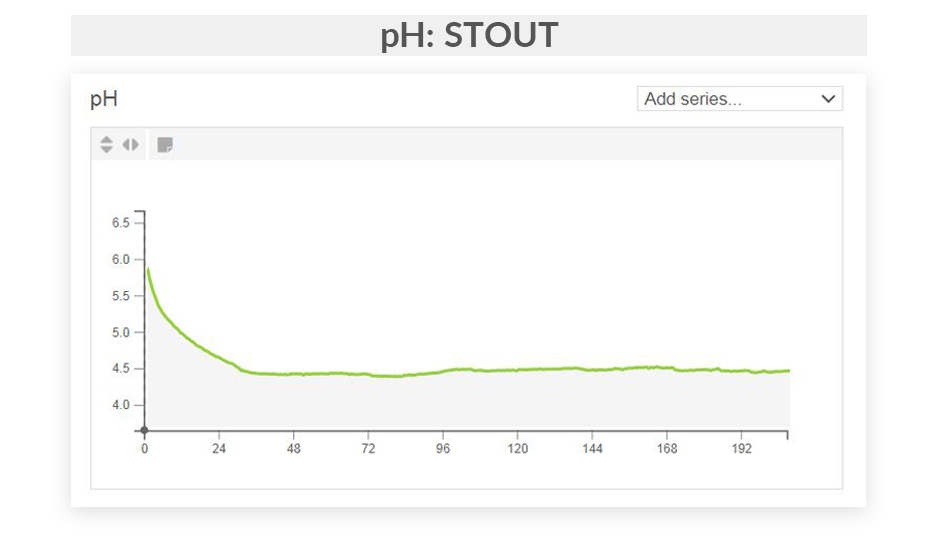
Figure 3: The pH of this stout starts quite high, just below 6, and then drops rapidly. The high starting point is likely due to the addition of mineral salts in the brewing process to achieve the flavor and mouthfeel found in stouts. Minerals such as calcium carbonate are often used to balance the acidity of roasted malts by raising the pH. Once the buffering capacity of the carbonate was overcome, the pH followed a consistent pattern of falling to its lowest level during the peak of fermentation, then rising slowly as a portion of the organic acids are consumed by the yeast.
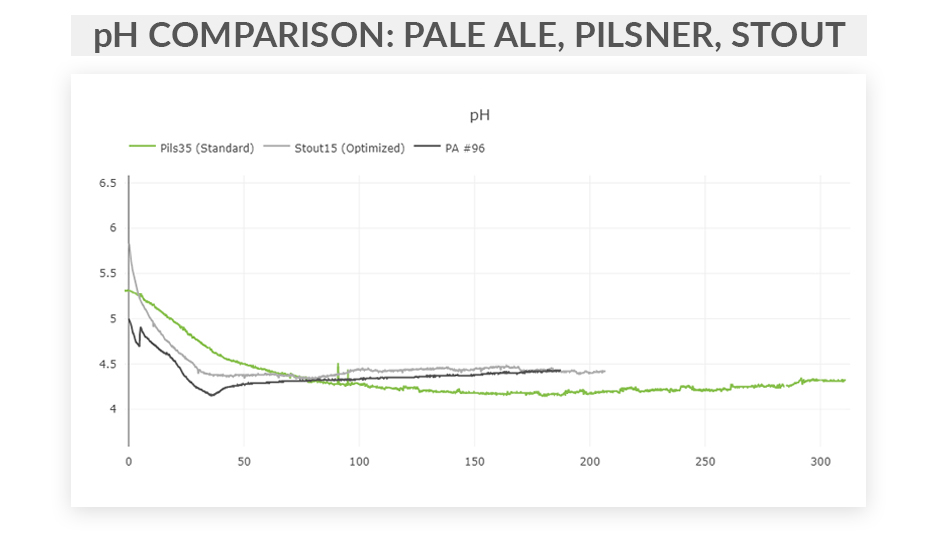
Figure 4: pH Comparison. Despite starting at a much higher pH, the stout finishes at about the same acid level of the pale ale. This is likely due to a larger overall gravity drop and subsequent acid production in the stout. The lager’s slower fermentation rate leads to a much slower production of acid. The softer water profile of the lager provides a lower overall buffering capacity to the other two beers, leading to a lower acid content of the final product.
Can fermentation management be improved, as a process? This eBook explores, in detail, how fermentation performance data analysis helps elevate product and business outcomes in a modern brewery, whether brewpub, microbrewery or regional craft brewer.
You will learn:
Day-by-day performance considerations – learned through the extensive examination of real-time fermentation tank data.
Key recommendations from the Precision Fermentation science team at each major step of fermentation – “Day zero” (i.e. before you pitch your yeast), the first 24 hours, and day two through the end of fermentation.
Best practices – Activity to watch out for, broken down by each key measurement – Dissolved oxygen, gravity, pH, pressure, internal/external temperature, and conductivity.
Key findings that can help you solve problems and improve your results.
We use cookies on our website to give you the most relevant experience by remembering your preferences and repeat visits. By clicking “Accept All”, you consent to the use of ALL the cookies. However, you may visit "Cookie Settings" to provide a controlled consent.
This website uses cookies to improve your experience while you navigate through the website. Out of these, the cookies that are categorized as necessary are stored on your browser as they are essential for the working of basic functionalities of the website. We also use third-party cookies that help us analyze and understand how you use this website. These cookies will be stored in your browser only with your consent. You also have the option to opt-out of these cookies. But opting out of some of these cookies may affect your browsing experience.
Necessary cookies are absolutely essential for the website to function properly. These cookies ensure basic functionalities and security features of the website, anonymously.
Cookie
Duration
Description
cookielawinfo-checkbox-advertisement
1 year
The cookie is set by GDPR cookie consent to record the user consent for the cookies in the category "Advertisement".
cookielawinfo-checkbox-analytics
11 months
This cookie is set by GDPR Cookie Consent plugin. The cookie is used to store the user consent for the cookies in the category "Analytics".
cookielawinfo-checkbox-analytics
11 months
This cookie is set by GDPR Cookie Consent plugin. The cookie is used to store the user consent for the cookies in the category "Analytics".
cookielawinfo-checkbox-analytics
11 months
This cookie is set by GDPR Cookie Consent plugin. The cookie is used to store the user consent for the cookies in the category "Analytics".
cookielawinfo-checkbox-functional
11 months
The cookie is set by GDPR cookie consent to record the user consent for the cookies in the category "Functional".
cookielawinfo-checkbox-necessary
11 months
This cookie is set by GDPR Cookie Consent plugin. The cookies is used to store the user consent for the cookies in the category "Necessary".
cookielawinfo-checkbox-others
11 months
This cookie is set by GDPR Cookie Consent plugin. The cookie is used to store the user consent for the cookies in the category "Other.
cookielawinfo-checkbox-performance
11 months
This cookie is set by GDPR Cookie Consent plugin. The cookie is used to store the user consent for the cookies in the category "Performance".
viewed_cookie_policy
11 months
The cookie is set by the GDPR Cookie Consent plugin and is used to store whether or not user has consented to the use of cookies. It does not store any personal data.
Functional cookies help to perform certain functionalities like sharing the content of the website on social media platforms, collect feedbacks, and other third-party features.
Performance cookies are used to understand and analyze the key performance indexes of the website which helps in delivering a better user experience for the visitors.
Analytical cookies are used to understand how visitors interact with the website. These cookies help provide information on metrics the number of visitors, bounce rate, traffic source, etc.
Cookie
Duration
Description
_ga
2 years
This cookie is installed by Google Analytics. The cookie is used to calculate visitor, session, campaign data and keep track of site usage for the site's analytics report. The cookies store information anonymously and assign a randomly generated number to identify unique visitors.
_gat_UA-114048588-1
1 minute
This is a pattern type cookie set by Google Analytics, where the pattern element on the name contains the unique identity number of the account or website it relates to. It appears to be a variation of the _gat cookie which is used to limit the amount of data recorded by Google on high traffic volume websites.
_gcl_au
3 months
This cookie is used by Google Analytics to understand user interaction with the website.
_gid
1 day
This cookie is installed by Google Analytics. The cookie is used to store information of how visitors use a website and helps in creating an analytics report of how the website is doing. The data collected including the number visitors, the source where they have come from, and the pages visted in an anonymous form.
CONSENT
16 years 5 months 2 days 7 hours
These cookies are set via embedded youtube-videos. They register anonymous statistical data on for example how many times the video is displayed and what settings are used for playback.No sensitive data is collected unless you log in to your google account, in that case your choices are linked with your account, for example if you click “like” on a video.
vuid
2 years
This domain of this cookie is owned by Vimeo. This cookie is used by vimeo to collect tracking information. It sets a unique ID to embed videos to the website.
Advertisement cookies are used to provide visitors with relevant ads and marketing campaigns. These cookies track visitors across websites and collect information to provide customized ads.
Cookie
Duration
Description
IDE
1 year 24 days
Used by Google DoubleClick and stores information about how the user uses the website and any other advertisement before visiting the website. This is used to present users with ads that are relevant to them according to the user profile.
test_cookie
15 minutes
This cookie is set by doubleclick.net. The purpose of the cookie is to determine if the user's browser supports cookies.
VISITOR_INFO1_LIVE
5 months 27 days
This cookie is set by Youtube. Used to track the information of the embedded YouTube videos on a website.
YSC
session
This cookies is set by Youtube and is used to track the views of embedded videos.
yt-remote-connected-devices
never
These cookies are set via embedded youtube-videos.
yt-remote-device-id
never
These cookies are set via embedded youtube-videos.