
BrewMonitor: A Look at Fermentation Data Curves – Process Innovation
BrewMonitor® offers your brewing team access to insight that has never been available before: high-resolution data from inside your fermentation tank, allowing you to track the progress of your fermentation, analyze results, benchmark future batches, and much more. The resulting graphs for each completed fermentation – dissolved oxygen, pH, gravity, pressure, temperature and conductivity – provide extremely clear views into the events that transpired and techniques that were employed. This series of articles shows examples of data curves from specific parameters, as they were recorded from the fermentation of various styles in different scenarios. These graphs are from actual fermentations, and offered as a look into how these conditions express themselves as measured data trends.
In this installment, we discuss some examples of how brewing processes can be innovated through the analysis of high-frequency data (and the resulting curves).
See our earlier Fermentation Data Curves posts:
Typical Gravity Curves »
Typical pH Curves »
Typical Conductivity Curves »
Fermenter Failures »
Yeast Issues »
Decreasing Time-in-Tank
For some beverage producers, their total product output is limited by available tank space. Each batch passing through their process requires a fixed period of time to complete, depending on the product i.e. lagers and meads taking a month or more in primary fermentation. Each additional day that a batch spends in a given tank is a day that the product is not in the market, and the next batch must wait before starting. In an industry where profit is tied closely to volume output, gaining a single day back on each fermentation can result in a drastic increase in profitability.
On the other hand, fermentation is a complex biological process dependent on myriad factors. Increasing the rate of fermentation can cause issues with product quality, stability, and profitability by causing unnecessary stress on the yeast or other fermentative organisms. Balancing time-in-tank with desired sensory results is critical, which often restricts changes to the timing of the process to relatively small increments. This is where high frequency data is immensely helpful.
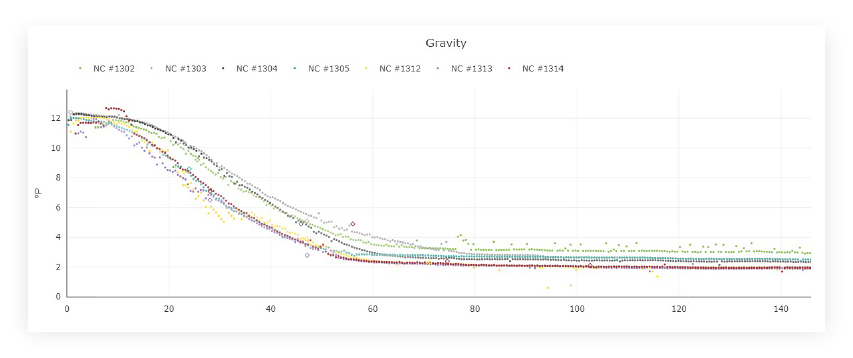
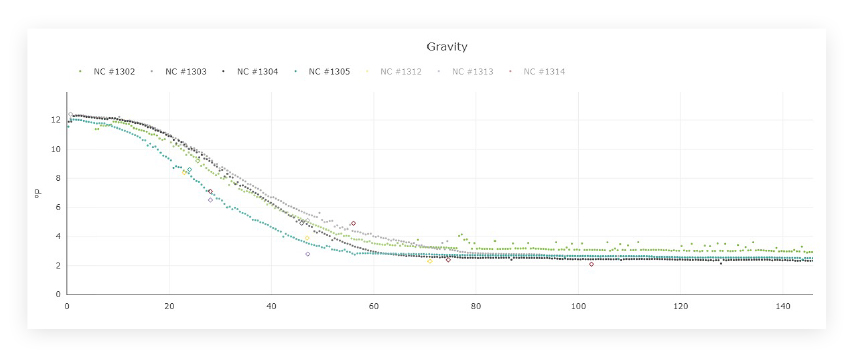
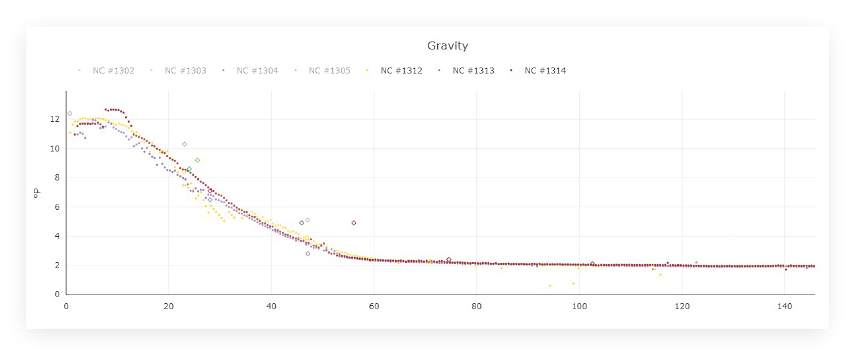
The data sets in this section were taken from a series of fermentations over the course of five months. Graphs are overlaid for gravity readings taken from individual batches that fermented during that time, starting with batch #1302 and ending with batch #1314.
Notice on the early batches (#1302 – #1305) the relative inconsistency of the time taken for the gravity to reach terminal, as well as the varying levels of attenuation achieved. For those batches, the measured terminal gravity at hour 120 (five days after pitch) ranges between 3 and 2.4 degrees plato. These variations can be caused by undetectable differences in process, raw material input, or health of the yeast, yet they add guesswork to the fermentation process. By gathering high-frequency data, the brewer can tell when the fermentation has reached terminal gravity to within a few hours, and can make an informed decision on when to start the conditioning process.
In comparison, the latter batches (#1312 – #1314) display greater consistency in time-to-terminal while also achieving a consistently high total attenuation. Terminal gravity for each is measured at a highly consistent rate just below 2 degrees Plato, and reaches that mark around hour 90.
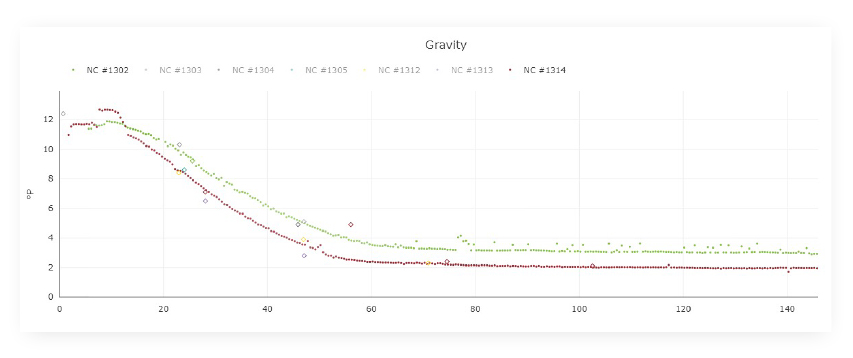
Using high-frequency data to map multiple batches of information in this way can help illuminate the small adjustments needed in order to optimize throughput efficiency of an existing fermentation system without adding additional tanks or, most importantly, sacrificing product integrity.
Hop Creep
Brewers have continued pushing the limits of dry-hopping further and further since the advent of the New England IPA emerged on the craft beer scene. Adding hop compounds during and after fermentation increases the punch of the fruity, floral, or resinous characteristics of these IPA’s but that potency comes at a cost.
The most common type of hop product is the hop pellet: hop cones that have been ground, pressed, and extruded to make the product more user friendly and expose more of the oil glands in the cone. That grinding also exposes the interior of the hop cone which contains all of the enzymes present in the original plant. When enzymes like hop amylases are added to beer, they can break down unfermentable polysaccharides into fermentable sugars. With live yeast still present in the young beer, these sugars will be consumed and fermented. This produces the phenomenon known as hop creep, or slow breakdown and fermentation of residual sugars due to the presence of amylase enzymes.
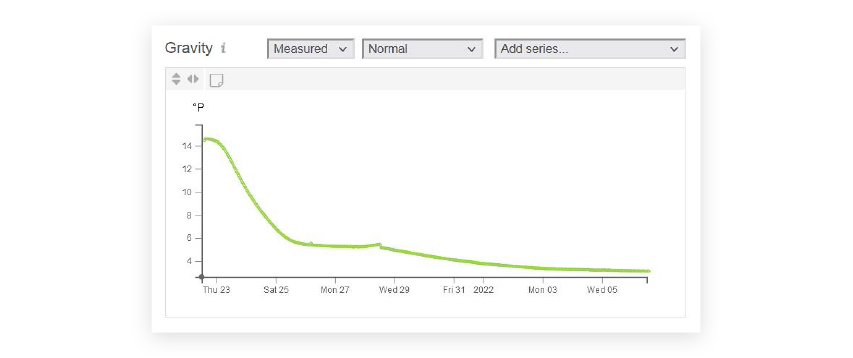
This BrewMonitor graph represents the gravity curve of a beer tracked using real-time fermentation monitoring. This old ale was intentionally under-attenuated through a combination of high mash temperatures and using US-05. A moderate dry hop charge (1.5Lbs per Bbl) of East Kent Goldings was added after the beer reached terminal gravity. The long, slow secondary fermentation took nearly a week to reach the new terminal gravity, two days longer than primary fermentation.
If the beer is given enough time in tank, the yeast can simply ferment these new sugars normally. The additional fermentation activity means that more diacetyl precursors will be produced and the beer will require even more time to condition and mature properly. More time spent in tank translates directly to production slowdown and a decrease in profitability for the brewery. Using real-time fermentation monitoring to gain insight on the fermentation progress, it is possible to adjust the dry hopping schedule and give brewers the ability to experiment with their dry-hopping schedule to minimize time-in-tank while maintaining the sensory profile of their brands.
Free eBook: Leveraging Data-Driven Fermentation Performance Management

Can fermentation management be improved, as a process? This eBook explores, in detail, how fermentation performance data analysis helps elevate product and business outcomes in a modern brewery, whether brewpub, microbrewery or regional craft brewer.
You will learn:
- Day-by-day performance considerations – learned through the extensive examination of real-time fermentation tank data.
- Key recommendations from the Precision Fermentation science team at each major step of fermentation – “Day zero” (i.e. before you pitch your yeast), the first 24 hours, and day two through the end of fermentation.
- Best practices – Activity to watch out for, broken down by each key measurement – Dissolved oxygen, gravity, pH, pressure, internal/external temperature, and conductivity.
- Key findings that can help you solve problems and improve your results.