
BrewMonitor: A Look at Fermentation Data Curves – Experimental Fermentation Products
BrewMonitor® offers your brewing team access to insight that has never been available before: high-resolution data from inside your fermentation tank, allowing you to track the progress of your fermentation, analyze results, benchmark future batches, and much more. The resulting graphs for each completed fermentation – dissolved oxygen, pH, gravity, pressure, temperature and conductivity – provide extremely clear views into the events that transpired and techniques that were employed. This series of articles shows examples of data curves from specific parameters, as they were recorded from the fermentation of various styles in different scenarios. These graphs are from actual fermentations, and offered as a look into how these conditions express themselves as measured data trends.
In this installment, we discuss some examples of different fermentation products through the analysis of high-frequency data (and the resulting curves).
See our earlier Fermentation Data Curves posts:
Typical Gravity Curves »
Typical pH Curves »
Typical Conductivity Curves »
Fermenter Failures »
Yeast Issues »
Process Innovation »
Seltzer
Since the summer of 2017, seltzers have been a staple of every barbeque and beach trip. However, state-based liquor restrictions may prevent beverage suppliers from making refreshing seltzers by simply adding neutral spirits to carbonated water. To take advantage of the trend, they instead have to ferment simple sugars as cleanly as possible which means keeping a careful eye on yeast health.
Brewing yeast are highly sensitive to osmotic pressure from dissolved solids (sugar in this case) and their stress response usually includes acidifying their environment. To further compound the stressors, seltzers usually contain none of the buffering compounds found in beer that slow the pH change of the solution.
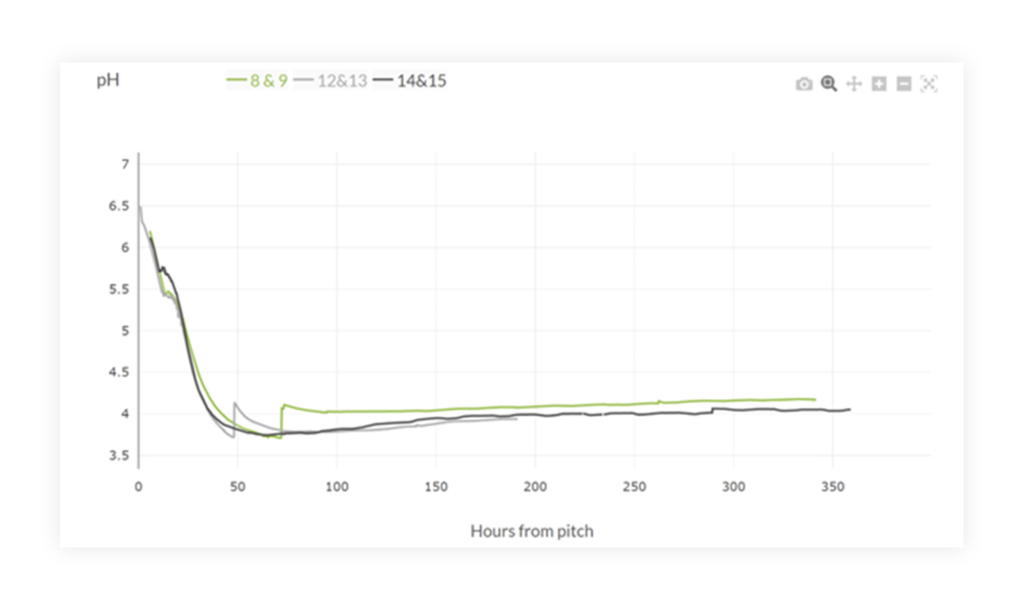
This graph represents the pH of three batches of alcoholic seltzer base. Most notably, the overall pH change is greater than that of a typical beer fermentation, dropping nearly 3.3 pH points (keep in mind that pH is logarithmic, that means over 1000x more acidic!). Actively monitoring pH can allow a brewer to prevent over-acidification and produce a more consistently flavor-neutral base. In each of the above batches, the brewer experimented with the timing of nutrient additions, which have the added benefit of balancing the pH levels slightly and removes some stress from the yeast.
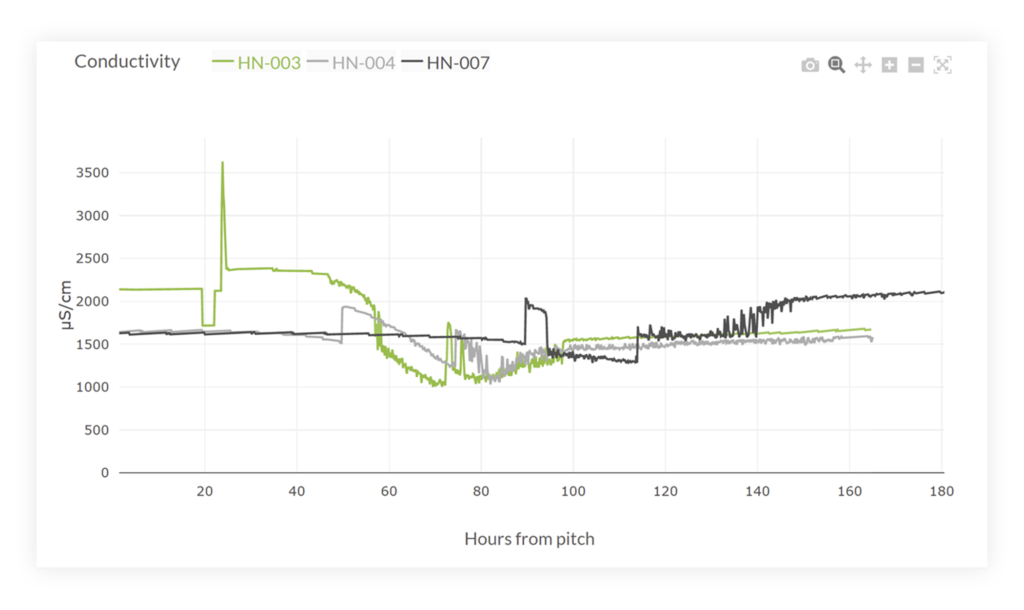
Cider
Americans have been drinking cider since the earliest colonists landed (yep, even earlier than beer), and the New World’s climate proved to be a perfect fit for the fruit trees. With the development of new styles and interest from orchard owners everywhere, the crisp beverage has made a resurgence in the craft market.
Similar to wine or seltzer, the lack of nutrients like free-amino nitrogen in cider can make fermentations tricky to perfect. Adding nitrogen compounds will aid the yeast in their noble work, but it is important to dial in how much to add and at what point. One cider producer has found that monitoring the conductivity of their product can allow them to make multiple small additions of nutrients as the yeast consume their available supply.
Non-Alcoholic Beer
A handful of large breweries have offered alcohol free beers for decades, but just as the “session” beer trend showed that low abv drinks can be delicious, a new wave of N/A beers have proven that craft producers can make attractive options. There are a few methods to achieve the distinctive flavor of malt beverages with no alcohol, but this article will focus on one in particular.
In the US, non-alcoholic beverages are defined as having less than 0.5% ABV, so some fermentation is allowed to occur without producing an alcoholic beverage. One award-winning N/A beer producer uses this definition to make genuine beer from malt, hops, and yeast, but containing much less than the 0.5% limit.
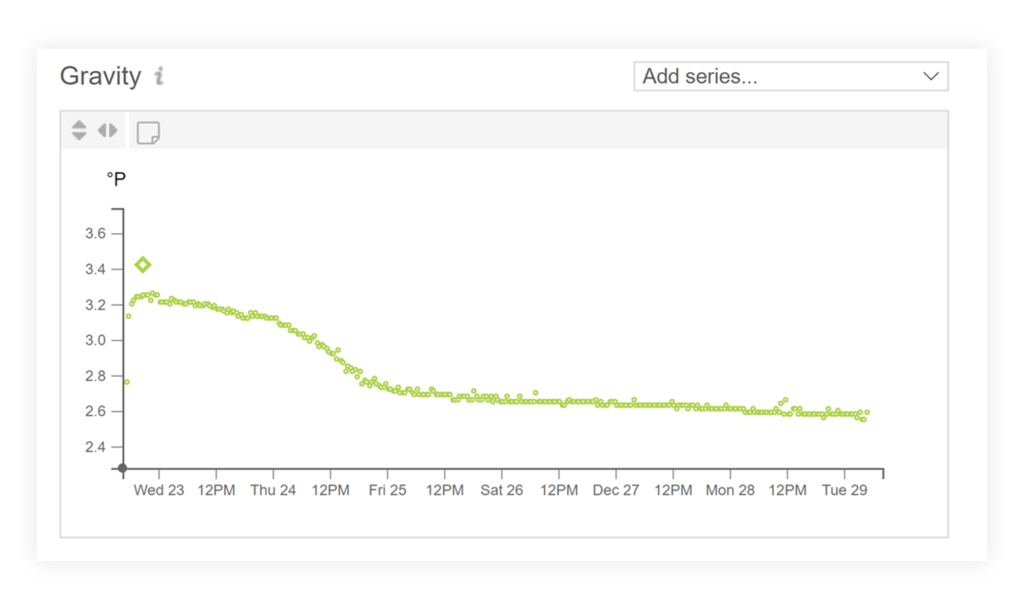
The graph above shows the gravity curve of the N/A beer producer, and it’s shockingly different from the graphs we are used to seeing from beer. First, they use only enough malt to give the beer some sugar and plenty of flavor, but the starting gravity is much lower than a standard brew. Second, they stop the fermentation after a 0.5 degree Plato drop. This means that a minimal amount of alcohol has been produced, but the yeast have had enough time to produce the flavor compounds found in beer. By monitoring the gravity closely, they can see exactly when fermentation begins and when they want it to end, all without taking manual samples or risking a higher ABV than intended.
Free eBook: Leveraging Data-Driven Fermentation Performance Management
Can fermentation management be improved, as a process? This eBook explores, in detail, how fermentation performance data analysis helps elevate product and business outcomes in a modern brewery, whether brewpub, microbrewery or regional craft brewer.
You will learn:
- Day-by-day performance considerations – learned through the extensive examination of real-time fermentation tank data.
- Key recommendations from the Precision Fermentation science team at each major step of fermentation – “Day zero” (i.e. before you pitch your yeast), the first 24 hours, and day two through the end of fermentation.
- Best practices – Activity to watch out for, broken down by each key measurement – Dissolved oxygen, gravity, pH, pressure, internal/external temperature, and conductivity.
- Key findings that can help you solve problems and improve your results.